
Updated October 2026 to match the current recap pages, with examples from data through September 2026.
Most Ohio sheriff sale investors analyze properties one at a time. They pull comps, estimate repairs, calculate ARV, and then decide whether to bid. That's fine for the final decision on a specific property, and the bid formula is where that decision belongs. But it skips a more basic question: should you even be looking at this county's docket this week?
We built county recap pages that answer that question in two numbers: sale rate and discount. Together, they tell you whether a county's auction environment leaves room for margin or whether prices have moved close to market value. Once you learn to read them, you can screen an entire county in under 60 seconds every Monday morning, then go deeper with the full county-selection guide when a market looks worth committing to.
This guide teaches you the framework, walks through real examples, and shows you how to build it into a weekly routine.
Prerequisites
Before this framework is useful, you need:
- A basic understanding of Ohio sheriff sales (you know what the docket is, you've looked at auction listings before)
- Access to county-level auction data. We publish weekly recaps for Ohio counties at auctionscout.app/recap/, which is what this guide references. You could build your own spreadsheet from county records, but it would take hours per week.
- Willingness to look at county-level trends before diving into individual properties. If you're the type who picks a property first and worries about market conditions later, this framework will feel backwards. That's intentional.
The two numbers: sale rate and discount
Every week, a county's sheriff sale docket has some number of properties listed. Some sell. The rest land in the other buckets on the recap's Auction Outcomes card: returned to lender, no sale (this includes lots that went to a second sale), postponed, cancelled / withdrawn, or result not yet reported. The sale rate is sold divided by the lots with a reported result. Lots still waiting on a result are left out, and the recap tells you how many there are in a note under the card ("Sale rate is sold ÷ resolved lots; N lots have no reported result yet").
For the properties that do sell, the recap compares each sale price with AuctionScout's estimated market value for that property and shows the median on the Median vs est. market value tile, as "N% below" or "N% above". That's the discount.
That's it. Two numbers.
Sale rate tells you how much of the docket actually changes hands. A 95% sale rate means almost everything with a result sold. A 50% sale rate means half didn't. Check the Outcomes card to see why: a postponed or cancelled lot never faced bidders, while a "no sale" lot went to auction and nobody bought it. Only the second one tells you anything about bidder demand.
Discount tells you what margins look like. "10% below" means the typical sale went for about 90% of estimated market value. Thin margins. "40% below" means about 60% of estimated market value. Wide margins, significant equity on day one. If the tile says "above", the typical buyer paid more than our estimate.
To judge whether a county's discount is deep or shallow, compare it with Ohio as a whole. Over the 12 months from October 2025 through September 2026, the median Ohio sheriff sale in our data went 37.0% below est. market value (3,386 sales with a market estimate). A county well above that is deeper than typical; a county well below it is shallower.
The framework: four quadrants
Combine the two numbers and you get four scenarios:
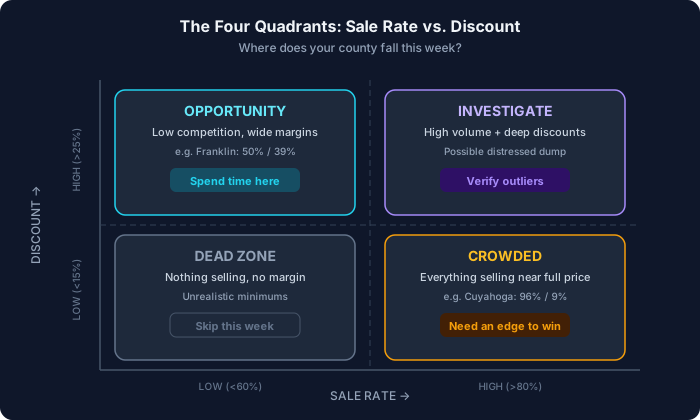
High sale rate + shallower discount than the Ohio median: Priced up. Almost everything sells, and it sells closer to market value than the typical Ohio sale. Unless you have a specific informational edge on a property, skip this week or tighten your max bid significantly.
Low sale rate + deeper discount than the Ohio median: Check the outcomes before you call it an opportunity. If most of the unsold lots show "no sale", they went to auction and nobody bought them: fewer buyers, wider margins, and this is where you want to be spending your research hours. If most were postponed or cancelled, the docket shrank before sale day and the low rate says nothing about buyers. Research only the lots likely to reach the auction.
High sale rate + deeper discount than the Ohio median: Unusual but it happens. Lots of properties selling at big discounts. Could signal a wave of distressed inventory hitting the market at once (think: large bank releasing a batch of REO). Worth investigating, but verify the data isn't skewed by one or two outlier sales.
Low sale rate + shallower discount than the Ohio median: Few properties sell, and the ones that do sell close to market value. If the misses are "no sale", minimum bids may be too close to market value for the math to work. Not much to do here.
Example: two dockets in the same week
An illustration with round numbers makes this concrete. It is not a real county's week.
County A lists 80 properties. 76 sell and 4 are cancelled. That's a 95% sale rate.
County B lists 20 properties. 10 sell, 4 are postponed and 6 are cancelled. That's a 50% sale rate.
On sale rate alone, County A looks priced up and County B looks like the opportunity. The Outcomes card says otherwise. None of County B's ten unsold lots is a "no sale": all ten were postponed or cancelled before the sale. That 50% says nothing about how many buyers showed up.
The discount needs more sales than one week gives you. Over the 12 months from October 2025 through September 2026, the median Cuyahoga County sale went 36.0% below est. market value (938 sales), and the median Franklin County sale went 26.4% below (256 sales). Against the Ohio median of 37.0%, Cuyahoga sat right at typical while Franklin was more than ten points shallower.
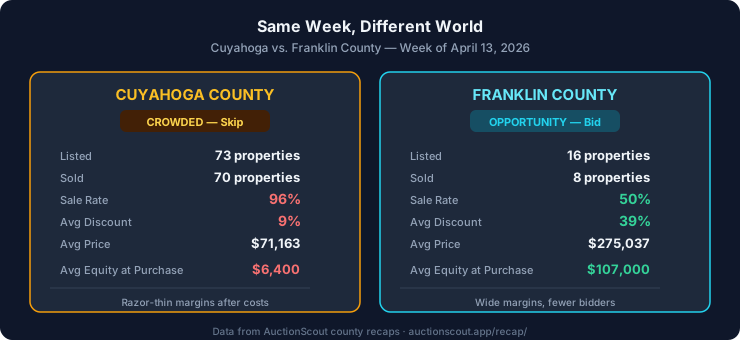
Same week, completely different dockets. Read the two numbers, then read the Outcomes card before you decide what they mean.
How to run this screen every Monday
The whole thing takes about 60 seconds per county once you've done it a few times.
Step 1: Pick your watchlist counties. Most investors focus on 3-5 counties within driving distance. You don't need to monitor every county in Ohio. Pick the ones where you'd actually bid and do rehab work.
Step 2: Check the recap page Monday morning. County recap data typically refreshes over the weekend after the prior week's sales finalize. Monday morning gives you the freshest read on what happened.
Step 3: Read the two numbers. Sale rate and the median vs est. market value. That's all you need for the initial screen.
Step 4: Apply the quadrant logic.
- Sale rate above 80% AND a median discount shallower than the Ohio median (37.0% below over the 12 months to September 2026)? Prices are close to market. Either skip this county this week or only bid on properties where you have a specific edge (you've driven by it, you know the neighborhood, you have a buyer lined up).
- Sale rate below 60%, a median discount deeper than the Ohio median, AND the unsold lots are mostly "no sale"? Opportunity territory. Spend your research time here. Pull properties from the docket, run your analysis, prepare bids.
- Sale rate below 60% because of cancellations and postponements? Those lots never reached bidders. Keep researching, but only lots likely to stay on the docket, and recheck it the day before the sale.
- Something in between? Use your judgment. The framework gives you a quick filter, not a rigid rule.
Step 5: Allocate your research time accordingly. If you have 10 hours this week for deal analysis, spend them on the county that passed your screen, not the one where margins are compressed.
The Monday ritual in practice
We publish a recap for every Ohio county AuctionScout tracks. Some investors have turned this into a literal Monday morning ritual: coffee, recap pages, 60-second screen, then decide where to focus for the week.
This doesn't replace property-level analysis. You still need to run comps, estimate repairs, and calculate your max bid on individual properties. The county screen tells you where to aim that effort so you don't waste 10 hours analyzing properties in a county where the margins disappeared three weeks ago.
Think of it like checking the weather before deciding which job site to visit. You're not making the final decision based on weather alone, but you'd be dumb to ignore it.
Common mistakes
Mistake 1: Looking at only one week's data. A single week can be an outlier. If a county normally runs 50% sale rate and one week hits 90%, check whether a single large seller dumped inventory. Look at the county page's weekly history and trend chart, not just the latest number.
Mistake 2: Treating all properties as equal within a county. The median blends every kind of home that sold with a market estimate (vacant land is left out). If the median is 40% below but the week's sales were mostly condemned properties nobody wanted, the margins on livable homes might be thinner. Use the county screen to decide where to look, then do property-level diligence.
Mistake 3: Ignoring volume. Say a county posts a 100% sale rate for the week. Sounds great. But only two properties were listed. That's not a trend, that's a coin flip. Counties with fewer than five sales in a week don't produce reliable signals.
Mistake 4: Chasing last week's winner. If Franklin County had a great week, every investor reading the same data will pile in next week. The best use of this framework is identifying consistent multi-week patterns, not chasing single-week spikes.
Mistake 5: Forgetting that sale type matters. Tax foreclosure and mortgage foreclosure sales behave differently. A county's overall numbers blend both. If possible, filter by sale type. Tax foreclosures often have lower sale rates (smaller bidder pool, especially since the affidavit rule kicked in April 2025).
FAQ
Q: Where do I find sale rate and discount data for Ohio counties?
We publish weekly recap pages for Ohio counties at auctionscout.app/recap/. Each weekly page shows properties listed, sold, the Auction Outcomes card with the sale rate, average sale price, median vs est. market value, and a recent-trend chart. Each county page adds the weekly history and a longer trend chart. The data updates weekly after sales finalize.
Q: What sale rate and discount thresholds should I use?
There's no universal answer. It depends on your strategy. Flippers with tight margins might skip anything above 70% sale rate. Buy-and-hold investors with longer time horizons might tolerate higher sale rates if the county's median sale is still at or deeper than the Ohio median. Start with the rules in Step 4 above, then adjust based on what works for your deal flow.
Q: Does this work for counties outside the top five?
Yes, but the signal gets noisier with low volume. Counties that only run 2-3 sales per week won't give you reliable trend data. For small-volume counties, look at monthly or rolling 4-week averages instead of individual weeks.
Q: How far back should I look at trends?
Each weekly recap shows the county's previous six weeks, and each county page has a trend chart across its full history (weekly, or monthly once there's more than half a year of weeks). That's enough to spot whether current conditions are normal or an outlier. If a county has been running 40% sale rates for eight straight weeks and suddenly spikes to 85%, something changed (fewer postponements and cancellations, a batch of easier properties, etc.). The Outcomes card shows which. The trend view tells you whether you're looking at the norm or the exception.
Q: Can I use this framework for counties in other states?
The logic applies anywhere you have sale rate and discount data. The specific numbers we cite are Ohio sheriff sale data, but "sale rate + outcomes + margin gauge = bid/skip decision" works in any auction environment. The challenge is getting consistent weekly data outside Ohio.
Put it to work
Open your county recap pages next Monday morning. Check the two numbers. Decide where to spend your week. It's a 60-second investment that can save you hours of research in the wrong county.
If you're not tracking county-level data yet, start your free trial at auctionscout.app. We update recap pages weekly for Ohio counties with sale rate, median vs est. market value, pricing trends, and trend charts. Pick your watchlist counties and build the Monday ritual into your process.