
Updated October 2026 with full second-quarter data.
Ohio sheriff sale discounts looked like they were compressing this spring. Weekly discount readings in Cuyahoga, Franklin, and Hamilton all looked thinner than earlier in the year. Thin margins are unforgiving of costs you did not budget for.
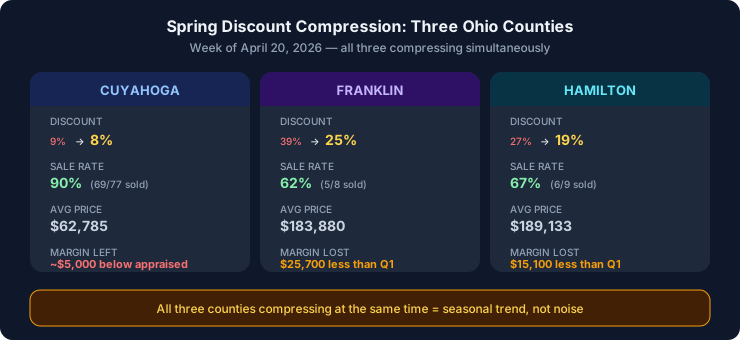
But those weekly readings rested on three or four sales per county with a market estimate. With the full second quarter in, the recap's measure (the median sale vs estimated market value) tells a different story: discounts held, and in Cuyahoga and Franklin they got deeper. Whichever way discounts move, the maximum bid you calculated is the only thing standing between you and a deal that loses money.
If you're bidding with assumptions from a single week, your numbers are noise.
The numbers: county by county, Q1 vs Q2
Three counties tell the story. Here is the week that looked like compression, and the quarter around it. All figures are AuctionScout data as of October 2026.
Cuyahoga County (week of Apr 20): 77 listed. Across Q2 2026, Cuyahoga listed 1,351 properties. The median sale went 41.2% below est. market value (280 sales), deeper than Q1's 33.8% (176 sales). (See live Cuyahoga data)
Franklin County (week of Apr 20): 8 listed. Across Q2, Franklin listed 146 properties. The median sale went 28.6% below est. market value (69 sales), up from 23.3% in Q1 (61 sales). Franklin is still the shallowest of the three. (See live Franklin data)
Hamilton County (week of Apr 20): 9 listed. The median sale went 31.4% below est. market value in Q2 (29 sales), close to Q1's 33.8% (23 sales). (See live Hamilton data)
That isn't compression. One county held steady and two got deeper. The April 20 readings were weekly noise, not a seasonal trend.
Is spring compression real? Not in our data
The theory sounds reasonable: spring brings more buyers to auction, more buyers bid more aggressively, and sale prices creep closer to market value. Our data doesn't show it in either year we can check. In 2025, the same Q1-to-Q2 move went the other way too: Cuyahoga's median sale went from 24.6% below est. market value in Q1 (116 sales) to 28.3% below in Q2 (122 sales), and Franklin's from 27.3% (37 sales) to 30.7% (48 sales). Hamilton had too few sales in those quarters to compare.
In Hamilton, a smaller share of the docket was pulled before the sale in Q2: AuctionScout recorded 31 of 59 lots as cancelled, withdrawn or postponed in Q1, and 31 of 68 in Q2. That says something about withdrawals, not about bidders.
The Cuyahoga volume question
Cuyahoga draws investors because of volume. 1,351 listings in Q2 dwarfs Franklin's 146 or Hamilton's 68. If you're looking to build a pipeline, Cuyahoga seems like the obvious choice.
The worry in April was that the volume came with thin margins. The quarter doesn't support that: Cuyahoga's Q2 median sale went 41.2% below est. market value, the deepest of the three. But Cuyahoga's properties are lower-priced, so that discount is a small number of dollars, and it has to absorb your deposit, your title work, your transaction costs, and any repair surprises. A few thousand dollars of surprises eat a bigger share of the spread, and for a flipper the dollar spread per deal matters more than the percentage.
We're not saying avoid Cuyahoga. But if you're drawn to it for volume alone, run the math on what the discount leaves you in dollars after costs. For many deals at that price point, the answer is less than the percentage suggests.
Where the margin still is (and how to track it weekly)
As a percentage, Cuyahoga had the most room of the three in Q2 (41.2% below est. market value), then Hamilton (31.4%) and Franklin (28.6%). In dollars, the order can flip, because Franklin's and Hamilton's sale prices run far higher than Cuyahoga's. A smaller percentage of a much bigger number is still the bigger cushion for renovation, holding costs, and the unknowns that come with every sheriff sale.
And Franklin's discount widened from Q1 to Q2, from 23.3% to 28.6%. Two quarters are only two data points, so keep watching.
The investors who do well are the ones tracking this data every week and checking it against the quarter. A single week can mislead you (the week of April 20 did), and a monthly check can leave you behind. Weekly tracking, read against a longer window, lets you see a real change while there's still time to adjust your max bid, shift to a different county, or sit out a cycle entirely.
We update county recap pages every week with every auction outcome, sale rates, average prices, the median vs est. market value, and trend charts. If you're bidding in any of these counties, check the data before you set your max bid, not after.
What to do with this data
None of this means stop investing. It means tighten up.
First, recalculate your max bids from enough sales to trust. A week with three or four sales can swing a county's discount by 20 points. Start from the quarter, then check the latest weeks for a change in direction.
Second, look at counties where competition hasn't arrived yet. Ohio has 88 counties. The three we covered are among the best-known markets. Smaller counties with less investor attention may still have wider discounts. The tradeoff is lower volume and less liquidity, but the margins can be better.
Third, track weekly, not monthly. Conditions move fast in spring. A monthly check means you're always behind. Weekly tracking lets you catch shifts before they cost you money.
And if discounts compress below your minimum margin threshold, sit it out. There's no rule that says you have to bid every week. The worst outcome isn't missing a deal. It's winning one at a price that doesn't work.
AuctionScout's county recap pages update weekly with sale rates, the median vs est. market value, and trend charts for the Ohio counties we track. Check the discount before you bid. Try AuctionScout free for 14 days.